python-pygwalker+streamlit python看板库使用体验
推荐 原创算作前言
在 B 站看到 pygwalker 的介绍,很感兴趣。
是一个类似于简化版的 tableau 工具。
原版 docs PyGWalker 文档 – Kanaries
搭建看板
直接结合 streamlit 使用,streamlit 真的神器。
import pygwalker as pyg
import pandas as pd
import streamlit.components.v1 as components
import streamlit as st

# 调整Streamlit页面的宽度
st.set_page_config(page_title="在Streamlit中使用PyGWalker", layout="wide")

# 添加标题
st.title("在Streamlit中使用PyGWalker")
df = pd.read_csv(r"C:\Users\htwl\Desktop\2024-03-25T01-03_export.csv")
# 导入你的数据
# df = pd.read_csv("https://kanaries-app.s3.ap-northeast-1.amazonaws.com/public-datasets/bike_sharing_dc.csv")
# 使用PyGWalker生成HTML
pyg_html = pyg.to_html(df)
# 将HTML嵌入到Streamlit应用程序中
components.html(pyg_html, height=1000, scrolling=True)
看板介绍
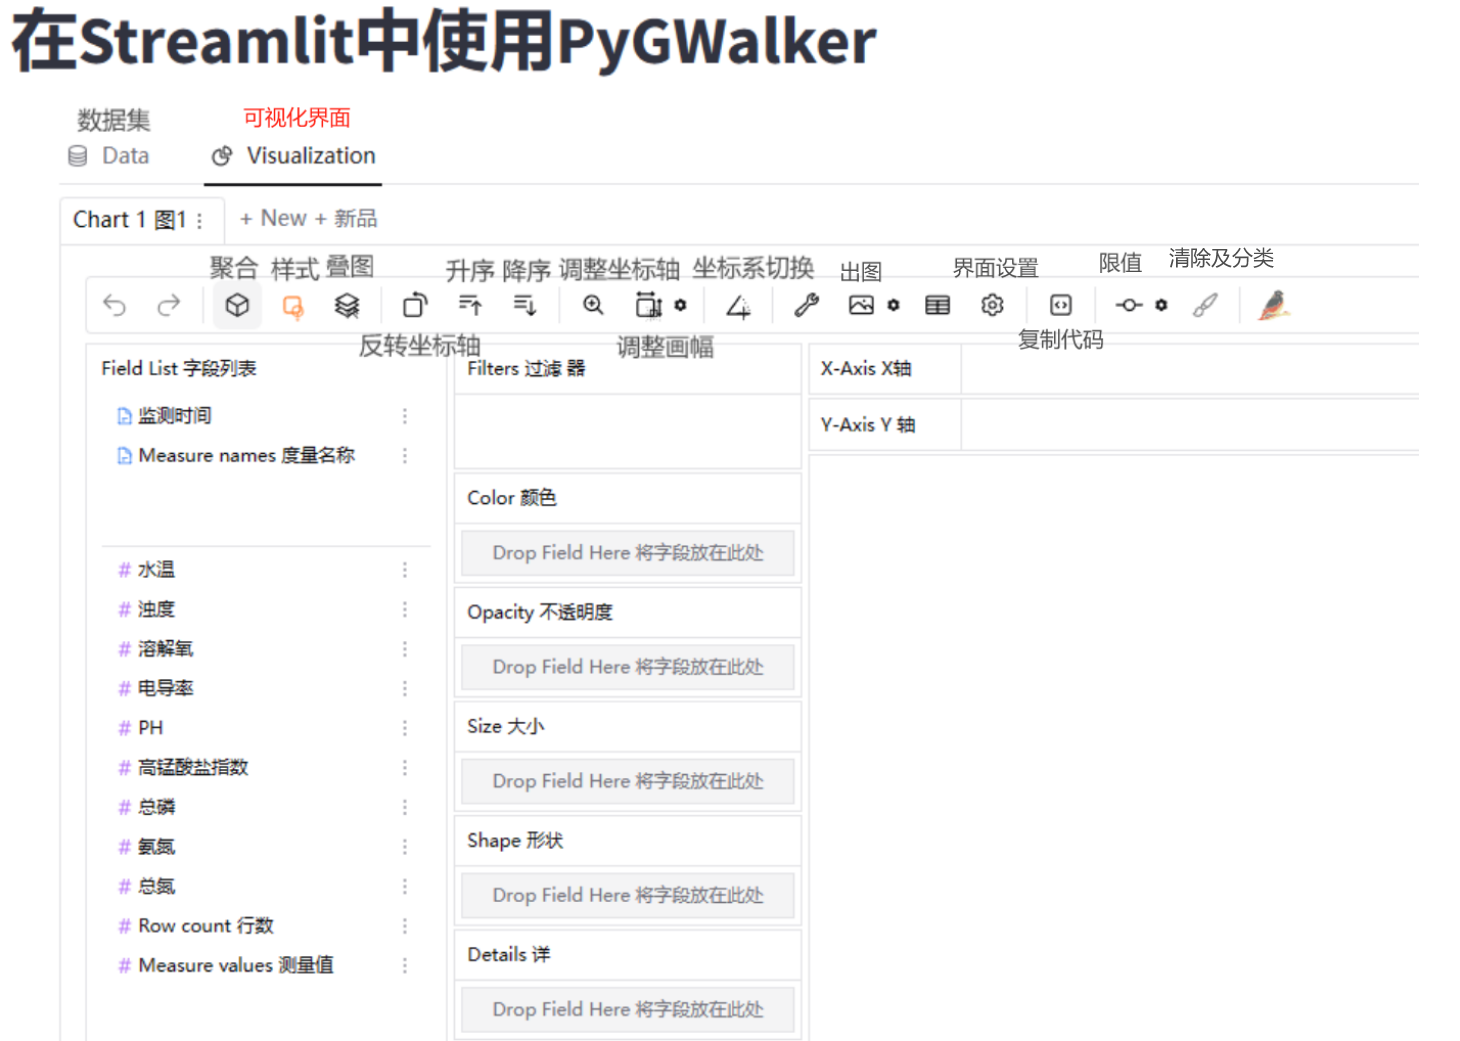
看板视图

具体如何创建看 doc:使用 Graphic Walker 创建数据可视化 – Kanaries
常规的柱状图、折线图、面积图、散点图都能做。
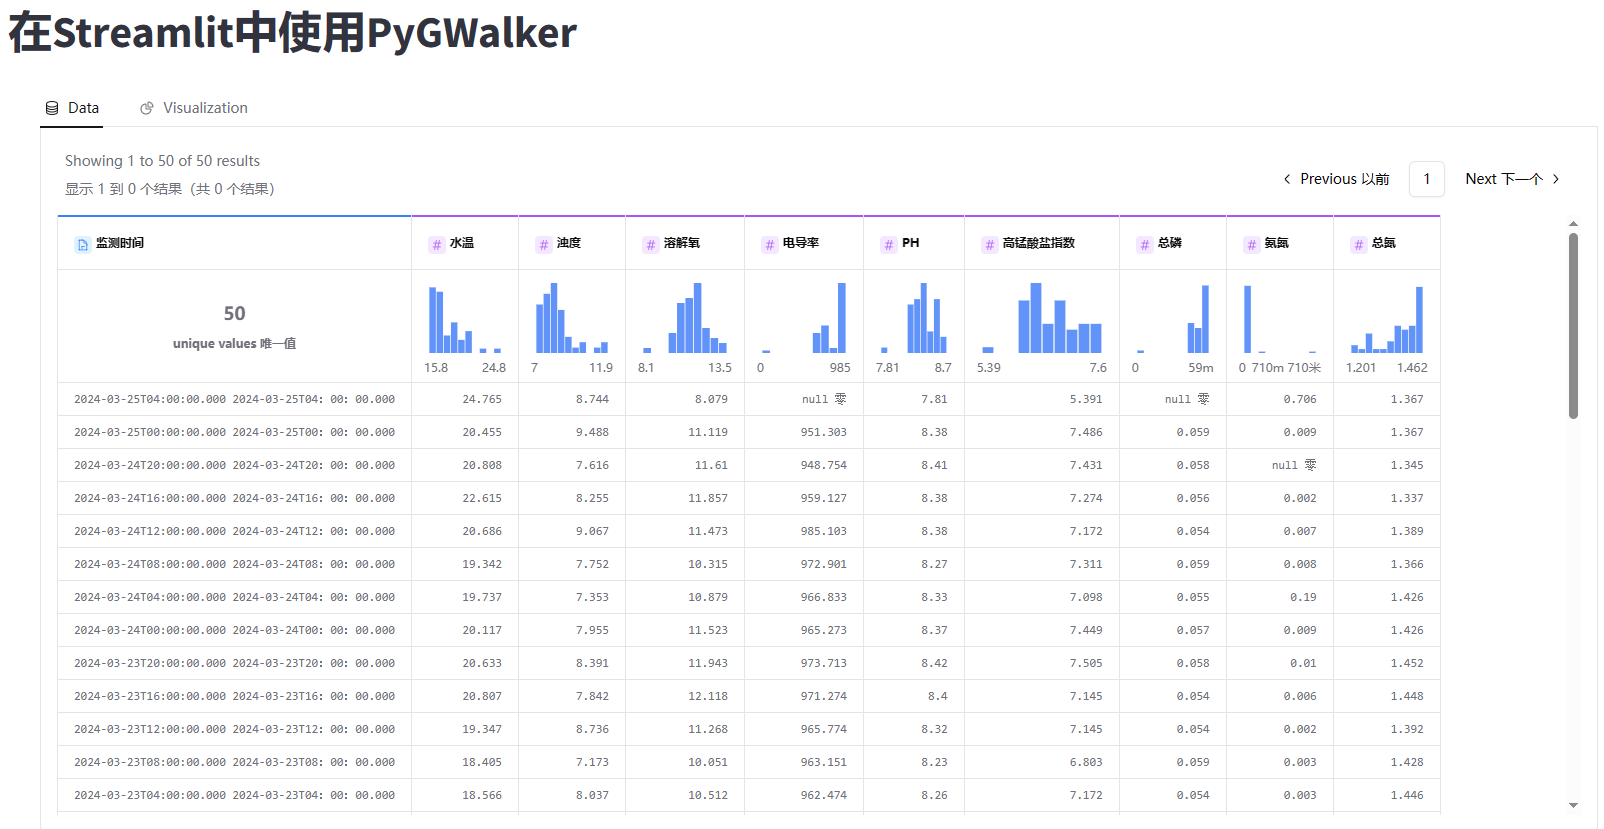
数据集视图

使用心得
- 类型为数据看板工具,优势是易上手,核心功能齐全搭建简单,方便分享,且免费。
- 缺点没有数据拼接功能,需要在 python 后台搭建好数据集。不能像 tableau 一样做表连接。
- 功能相对比较单一,比如散点图画趋势线,我没有找到具体的操作方法。可能做这个只是为了引流吧。
总体来说是一个很好的看板工具。
更多【python-pygwalker+streamlit python看板库使用体验】相关视频教程:www.yxfzedu.com
相关文章推荐
- 前端-js实现定时刷新,并设置定时器上限 - 其他
- 需求分析-2023-11-11 事业-代号s-duck-官网首页需求分析 - 其他
- node.js-【第2章 Node.js基础】2.5 Node.js 的定时器 - 其他
- 编程技术-parasoft Jtest 使用教程:防止和检查内存问题 - 其他
- hive-【Python大数据笔记_day06_Hive】 - 其他
- 算法-【C++入门】构造函数&&析构函数 - 其他
- unity-Unity地面交互效果——4、制作地面凹陷轨迹 - 其他
- python-Django如何创建表关系,Django的请求声明周期流程图 - 其他
- 算法-力扣21:合并两个有序链表 - 其他
- 算法-Leetcode2833. 距离原点最远的点 - 其他
- node.js-Node.js中的回调地狱 - 其他
- 人工智能-AIGC(生成式AI)试用 11 -- 年终总结 - 其他
- sqlite-计算机基础知识49 - 其他
- stable diffusion-AI 绘画 | Stable Diffusion 高清修复、细节优化 - 其他
- spring-SpringBoot中的桥接模式 - 其他
- 编程技术-Halcon WPF 开发学习笔记(2):Halcon导出c#脚本 - 其他
- mysql-【MySQL】视图 - 其他
- 编程技术-1994-2021年分行业二氧化碳排放量数据 - 其他
- 编程技术-SFTP远程终端访问 - 其他
- spring-【Spring】SpringBoot配置文件 - 其他
记录自己的技术轨迹
文章规则:
1):文章标题请尽量与文章内容相符
2):严禁色情、血腥、暴力
3):严禁发布任何形式的广告贴
4):严禁发表关于中国的政治类话题
5):严格遵守中国互联网法律法规
6):有侵权,疑问可发邮件至service@yxfzedu.com
近期原创 更多
